     |
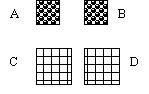
Part V: Six test patterns numbered 1 through 6 for use to determine the optimum width of a gray level or number of gray levels required. Each test pattern has 24 zones with 16 gray levels within each zone. The width of a gray level is one-sixteenth of the zone width. Each grating has OD ranging from 0.112 to 1.06. The only difference among patterns 1, 2, and 3, and among patterns 4, 5, and 6 is the spacing between zones. The gray level width in each of the 24 zones is as follows: The Width of one gray level
Part VI: This part helps users to match photoresist heights with specific optical density values (OD, or D herein after) in the range of 0.284 to 2.006 in the mask to build a calibration curve "height of photoresist after development vs. OD of mask pattern." Part VI exhibits 200 gray levels that are identified with labels, ranging from 00 to 199. Each gray level consists of one test patch, each test patch being 100µm x 100µm in size. The gray level i has an optical density value at 436nm wavelength according to the equation D = 0.284 + 0.0086532i, where i = 0, 1, 2 . . . 199. Thus, by using the equation, the minimum and maximum OD value of 200 patches can be determined to be 0.284 and 2.006, respectively. Although there are only 200 OD levels in the calibration patches, mask patterns having more than 1000 gray levels can be written in a HEBS-Glass Plate reproducibly. Any arbitrary value of OD in the OD range of 0.284 to 2.006 can be produced in HEBS-Glass Plate I85 to a precision of +/- 0.001 between adjacent gray levels. In general, the heights of resist thickness remaining will start to level off at an OD value between 0.8 to 1.2, because of the limited dynamic range of an analog photoresist. (Please see the CMI info sheet, "Photoresist Analog Transfer Scheme for HEBS-Glass Photomasks".) Because most photoresists have a limited dynamic range and respond to about 1 unit of OD value--for example, from 0.12 to 1.12, HEBS-Glass Plate HEBS5 is designed to satisfy this OD range with a thin e-beam sensitized glass layer of 1 micrometer. HEBS-Glass masks in I85 plates with a larger OD range can be useful for applications requiring resist thicknesses of more than 20 micron and also useful for use with certain photopolymers, sol gel, and other photoresists. HEBS-Glass Plates I85 having an e-beam sensitized glass layer of 3 micron is capable of OD values up to 4.0 using an e-beam accelerating voltage of 30KV or higher. Part VII: Part VII consists of tapered structures of variable heights for applications such as micro-prisms and micro-mirrors, and other 3-dimensional structures, each facet may have a unique compound tilt. The first column (00) are tapered structures with a constant delta OD and the second column (01) are tapered structures with a constant delta T between adjacent gray levels. Each 100mm x 100mm prism has 50 gray levels. The formula for the OD values of the 50 graylevels in each of 20 prisms of column 00 is Odi = ODmin + [(ODmax - ODmin)/49]*i, where i = 0, 1, 2, 3, 4,…,49. The formula for the transmittance values of the 50 graylevels in each of 20 prisms of column 01 is Ti = Tmax-[(Tmax-Tmin)/49]*i, where i = 0, 1, 2, 3, 4…,49. The OD ranges and the corresponding transmittance ranges for the prisms in both column 00 and 01 are as follows:
|
|||||||||||||||||||||||||||||||||||||||||||||||||||||||||||||||||||||||||||||||||||||||||||||||||||||||||||||||||||||||||||||||||||||||||||||||||||||||
|
Company | Technology | Products | Online Help | Contact |